Load test with Apache JMeter™ against Azure Media Services
This tutorial explains how to load testing to Azure Media Services from Apache JMeter™ and view that results.

Apache JMeter™ can perform load testing for streaming by the Azure Media Services.
This tutorial explains how to load testing to Azure Media Services streaming from JMeter with BlazeMeter - Video Streaming Plugin (HLS Plugin) and how to view that results.
In this case, the streaming videos are available to the public without any content protection.
Also, since JMeter and that plugin do not provide reports and graphs appropriate for load testing of video streaming, send the results to Azure Application Insights so that you can view the results in Application Insights and Log Analytics.
Not only Azure Media Services, but also other video delivery servers, you can do the same to view the results.
Outline of steps
- Get the endpoint URL of the video streaming
- Get the endpoint URL of the Azure Application Insights
- Install JMeter plugins
- Add a Thread Group
- Add a bzm - Streaming Sampler
- Add a backend listener
- Run the test
- View results with Application Insights / Log Analytics
Details of steps
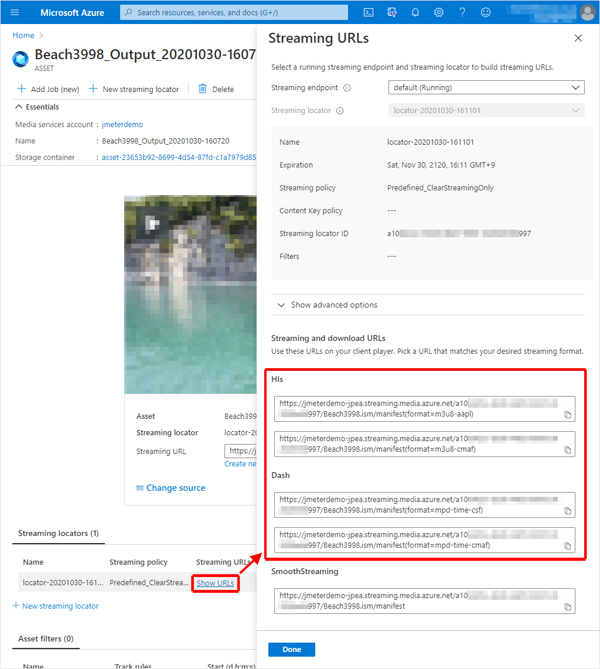
- Get the endpoint URL of the video streaming
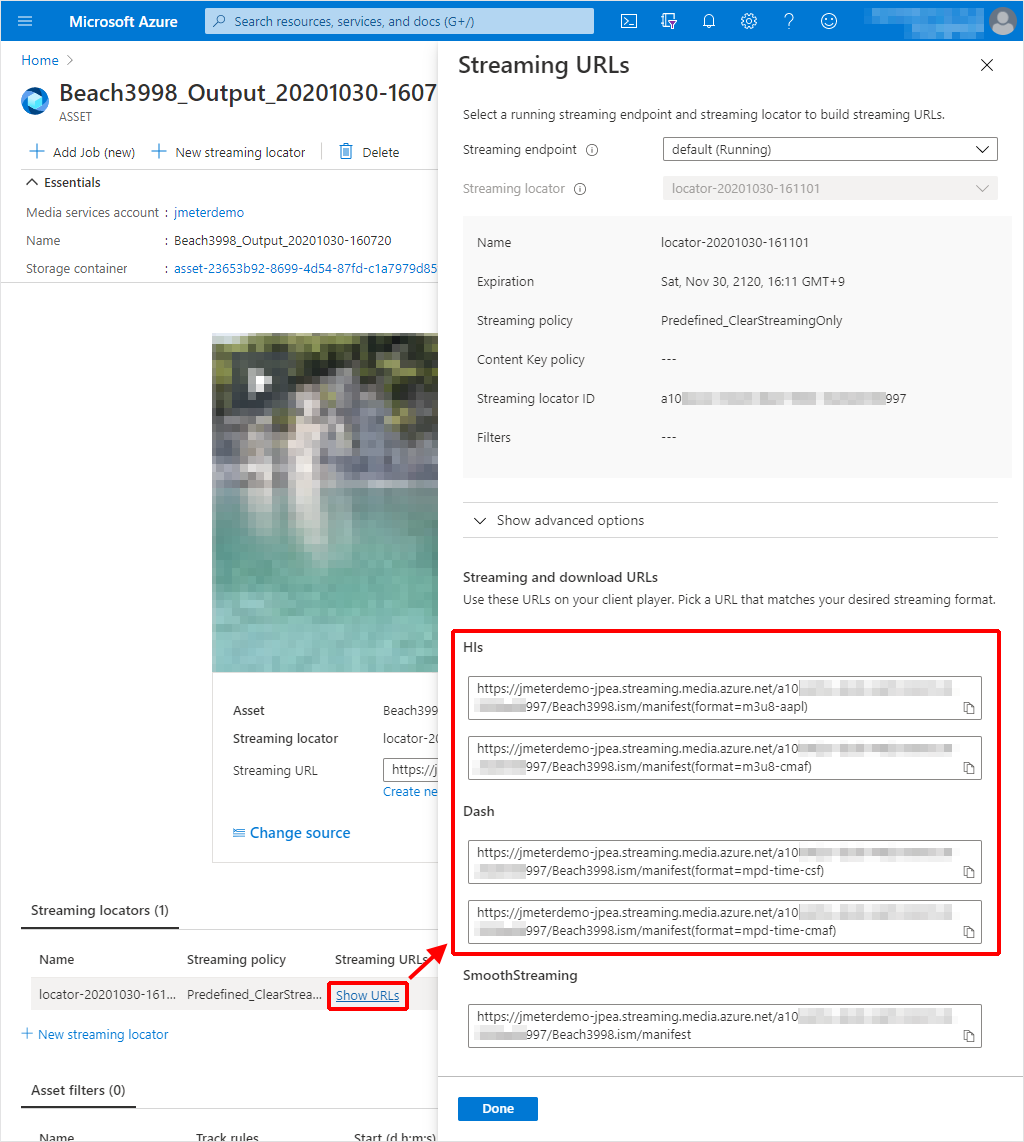
Get the streaming video endpoint URL by Azure Media Service.
In Azure Portal, go to “Assets (new) > {target asset}” of the target media service and click “Show URLs” to note down the endpoint URL of the protocol to be tested.
This value will be used later in the configuration of the Streaming Sampler in JMeter.
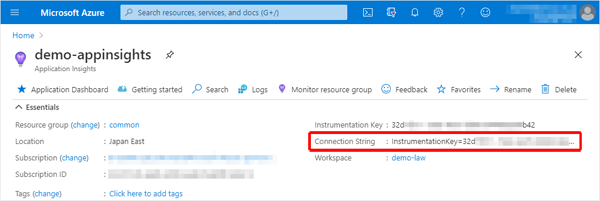
- Get the endpoint URL of the Azure Application Insights
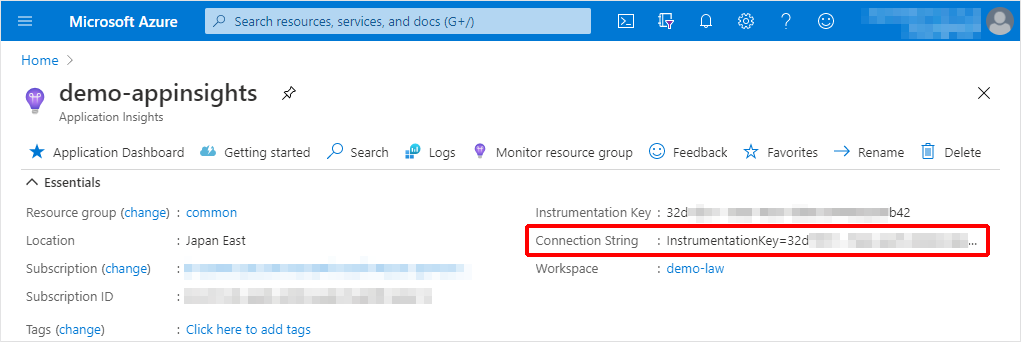
Get the Application Insights Connection String that JMeter will send the results to.
In Azure Portal, note the Connection String from the Application Insights Overview.
This value will be used later in the configuration of the Backend Listener in JMeter.
- Install JMeter plugins
Install the BlazeMeter - Video Streaming Plugin (HLS Plugin), a sampler for MPEG-DASH and HLS streaming, and the jmeter-backend-azure plugin to send JMeter results to Azure Application Insights.- Install the JMeter Plugins Manager
- Download JMeter Plugins Manager
Download the latest version of JMeter Plugins Manager from the following site.
https://jmeter-plugins.org/install/Install/ - Place the downloaded file in the JMeter plugin directory
Copy the JMeter Plugins Manager jar file that you just downloaded to $JMETER_HOME/lib/ext.
- Download JMeter Plugins Manager
- Install plugins
- Start or restart the JMeter
- Start the “JMeter Plugins Manager” from the menu Options > Plugins Manager.
- In the Available Plugins tab, select “BlazeMeter - HLS Plugin” and “Azure Backend listener”, and Click [Apply Changes and Restart JMeter] to restart the JMeter.
BlazeMeter - Video Streaming Plugin version 3.0.3 or earlier does not support HLS protocol delivery from Azure Media Services.
You can use version 3.1 or later, or replace version 3.0.3 with a jar file that I customized. - Install the JMeter Plugins Manager
- Add a Thread Group
Add a “Thread Group” to the Test Plan.
Add > Threads (Users) > Thread Group - Add a bzm - Streaming Sampler
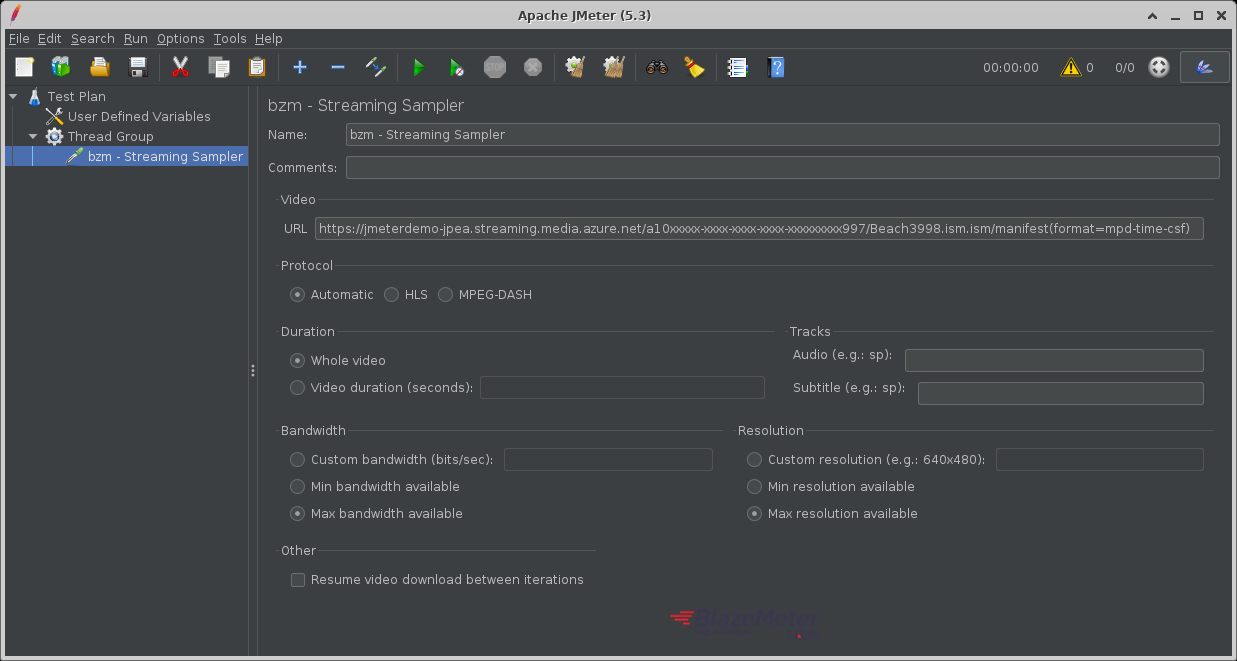
Add a “bzm - Streaming Sampler” to the Thread Group.
Add > Sampler > bzm - Streaming Sampler
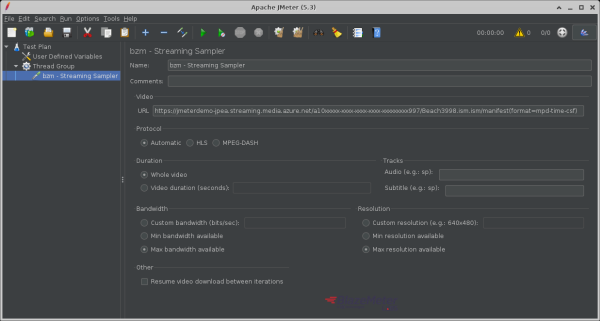
- Video
-
URL: Enter the Azure Media Services endpoint URL that you noted earlier.
eg.)https://jmeterdemo-jpea.streaming.media.azure.net/00000000-0000-0000-0000-000000000000/Filename.ism/manifest(format=m3u8-aapl)
-
- Protocol
If you want to test the HLS protocol from Azure Media Services, you need to select “HLS”.
For MPEG-DASH, please select either “Automatic” or “MPEG-DASH”.
Make the appropriate selection in Bandwidth and Resolution.
(In most cases, you will probably choose Max for both.) - Video
- Add a backend listener
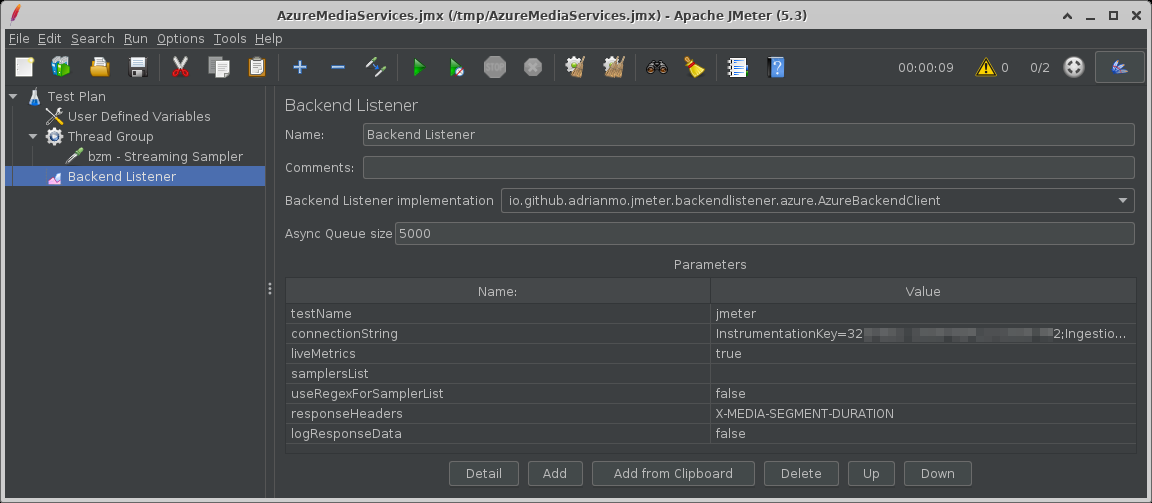
Add a “Backend Listener” to the test plan or thread group.
Add > Listener > Backend Listener

- Backend Listener implementation: “io.github.adrianmo.jmeter.backendlistener.azure.AzureBackendClient”
- Parameters
- testName:
Name of the test. This value is used to differentiate metrics across test runs or plans in Application Insights and allow you to filter them. - connectionString:
The Application Insights Connection String that you noted earlier. - responseHeaders: “X-MEDIA-SEGMENT-DURATION”
- testName:
- Run the test
View results with Application Insights / Log Analytics
This time, view result in Workbooks of Application Insights.
Note that the table and column names are different between Application Insights and Log Analytics.
This is a mapping of the table and columns referenced in the samples in this article.
| - | Application Insights | Log Analytics |
|---|---|---|
| Table | requests | AppRequests |
| Columns | name | Name |
| success | Success | |
| duration | DurationMs | |
| customDimensions | Properties |
-
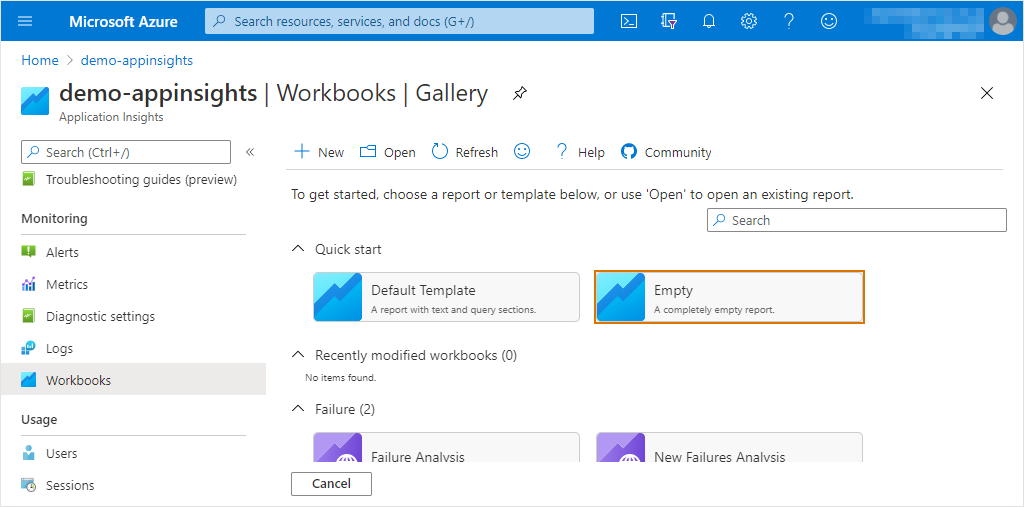
Create Application Insights Workbook
Open the Application Insights Workbooks to which JMeter is sending the results and click “Empty” in the Quick start.

-
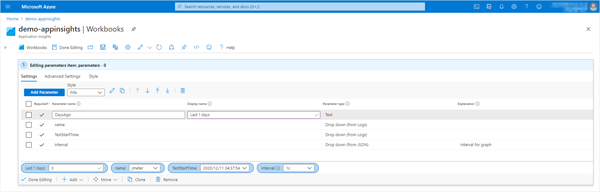
Add parameters
To create a selection of test results to be displayed, “+ Add” > “Add parameter” and add the following parameters.-
Parameter 1
- Parameter name: DaysAgo
- Display name: Last ? days
- Parameter type: Text
- Required?: On
- Add Validations
- Regular Expression: ^[0-9]+$
- Match: On
- Message: Enter a number greater than 1.
-
Parameter 2
- Parameter name: name
- Parameter type: Drop down
- Required?: On
- Get data from: Query
- Application Insights Logs Query
-
Time Range: Set in query
-
Kusto
requests | where timestamp >= ago({DaysAgo}d) | summarize TestStartTime = max(tolong(customDimensions.TestStartTime)) by name = tostring(name) | sort by TestStartTime desc | project name
-
-
Parameter 3
- Parameter name: TestStartTime
- Parameter type: Drop down
- Required?: On
- Get data from: Query
- Application Insights Logs Query
-
Time Range: Set in query
-
Kusto
requests | where name == "{name}" and timestamp >= ago({DaysAgo}d) | extend TestStartTime = tostring(customDimensions.TestStartTime) | distinct TestStartTime | project TestStartTime, formattedTestStartTime = format_datetime( unixtime_milliseconds_todatetime(tolong(TestStartTime)), 'yyyy/MM/dd HH:mm:ss' ) | sort by TestStartTime desc
-
-
Parameter 4
-
Parameter name: interval
-
Parameter type: Drop down
-
Required?: On
-
: interval for graph
-
Get data from: JSON
-
JSON Input
["1s", "1m", "10m", "1h", "1d"]
-
Once you are done with the settings, choose the appropriate value.
-
-
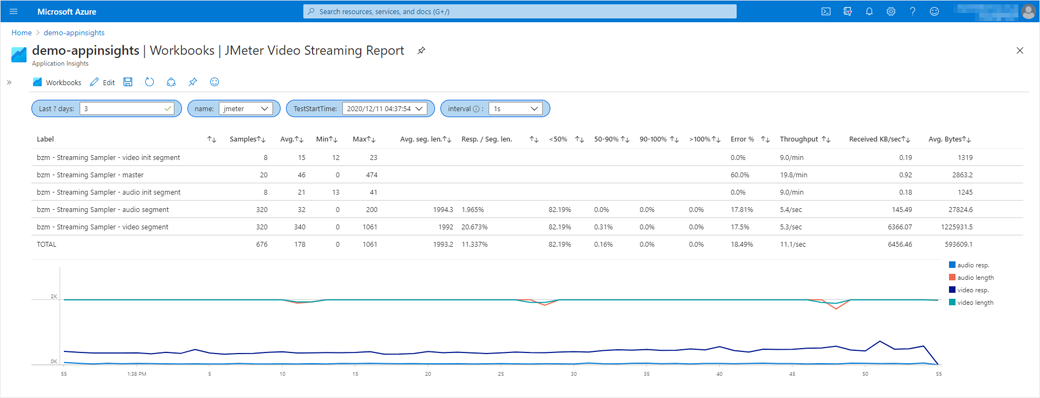
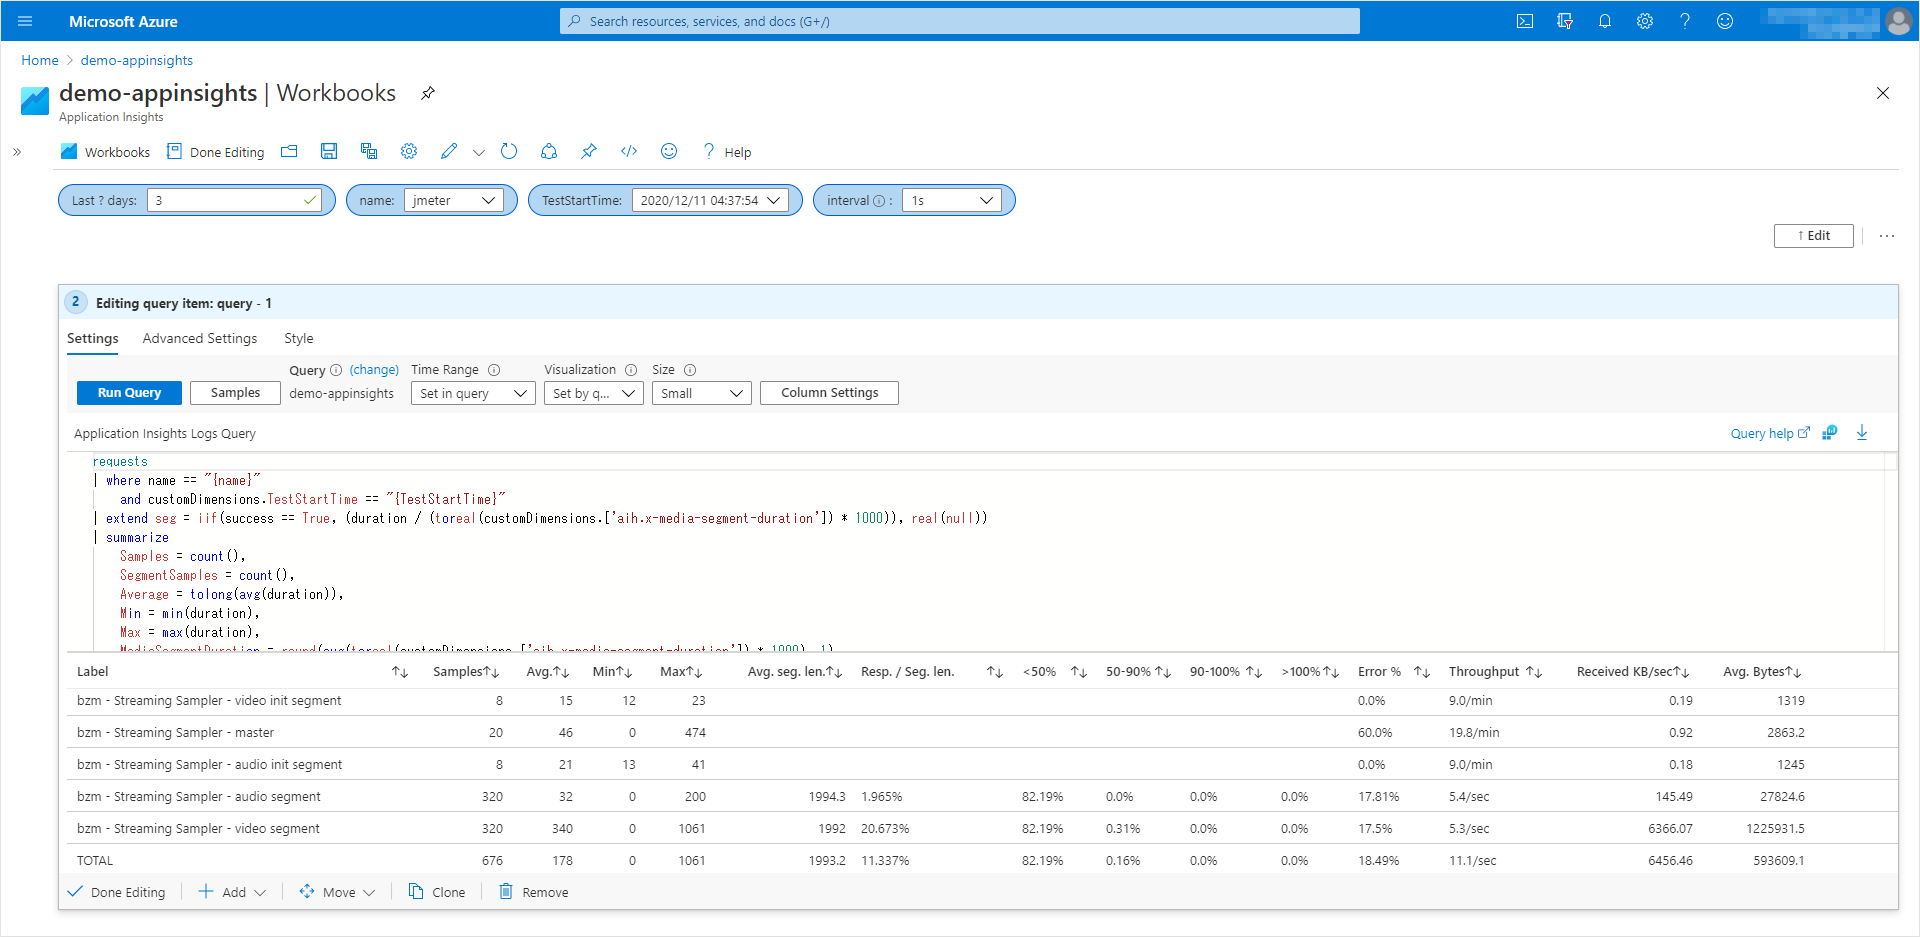
Create Video Streaming Report
Click “+ Add” > “Add query” to add the table.- Time Range: Set in query
- Application Insights Logs Query
requests | where name == "{name}" and customDimensions.TestStartTime == "{TestStartTime}" | extend seg = iif(success == True, (duration / (toreal(customDimensions.['aih.x-media-segment-duration']) * 1000)), real(null)) | summarize Samples = count(), SegmentSamples = count(), Average = tolong(avg(duration)), Min = min(duration), Max = max(duration), MediaSegmentDuration = round(avg(toreal(customDimensions.['aih.x-media-segment-duration']) * 1000), 1), SegAvg = avg(seg), lt50per = countif(seg <= 0.5), 50to90per = countif(seg > 0.5 and seg <= 0.9), 90to100per = countif(seg > 0.9 and seg <= 1), gt100per = countif(seg > 1), ErrorCount = countif(success == false), ReceivedKB = sum(tolong(customDimensions.Bytes)), StartTime = min(tolong(customDimensions.SampleStartTime)), EndTime = max(tolong(customDimensions.SampleEndTime)) by Label = tostring(customDimensions.SampleLabel) | extend s = 0 | union ( requests | where name == "{name}" and customDimensions.TestStartTime == "{TestStartTime}" | extend seg = iif(success == True, (duration / (toreal(customDimensions.['aih.x-media-segment-duration']) * 1000)), real(null)), segWerror = customDimensions.['aih.x-media-segment-duration'] | summarize Samples = count(), SegmentSamples = countif(toreal(segWerror) > 0), Average = tolong(avg(duration)), Min = min(duration), Max = max(duration), MediaSegmentDuration = round(avg(toreal(customDimensions.['aih.x-media-segment-duration']) * 1000), 1), SegAvg = avg(seg), lt50per = countif(seg < 0.5), 50to90per = countif(seg > 0.5 and seg <= 0.9), 90to100per = countif(seg > 0.9 and seg <= 1), gt100per = countif(seg > 1), ErrorCount = countif(success == false), ReceivedKB = sum(tolong(customDimensions.Bytes)), StartTime = min(tolong(customDimensions.SampleStartTime)), EndTime = max(tolong(customDimensions.SampleEndTime)) | extend Label = 'TOTAL', s = 9 ) | extend tp = Samples / ((EndTime - StartTime) / 1000.0), KBPeriod = (EndTime - StartTime) * 1024 / 1000.0 | sort by s asc | project Label, Samples, ['Avg.'] = Average, Min, Max, ['Avg. seg. len.'] = iif(SegAvg >= 0, toreal(MediaSegmentDuration), real(null)), ['Resp. / Seg. len.'] = iif(SegAvg >= 0, strcat(round(SegAvg * 100, 3), '%'), ''), ['<50%'] = iif(SegAvg >= 0, strcat(round(lt50per * 100.0 / SegmentSamples, 2), '%'), ''), ['50-90%'] = iif(SegAvg >= 0, strcat(round(50to90per * 100.0 / SegmentSamples, 2), '%'), ''), ['90-100%'] = iif(SegAvg >= 0, strcat(round(90to100per * 100.0 / SegmentSamples, 2), '%'), ''), ['>100%'] = iif(SegAvg >= 0, strcat(round(gt100per * 100.0 / SegmentSamples, 2), '%'), ''), ['Error %'] = strcat(round(ErrorCount * 100.0 / Samples, 2), '%'), ['Throughput'] = iif(tp < 1.0, strcat(round(tp * 60, 1), '/min'), strcat(round(tp, 1), '/sec') ), ['Received KB/sec'] = round(ReceivedKB / KBPeriod, 2), ['Avg. Bytes'] = round(ReceivedKB / toreal(Samples), 1) | project-reorder Label, Samples, ['Avg.'], Min, Max, ['Avg. seg. len.'], ['Resp. / Seg. len.'], ['<50%'], ['50-90%'], ['90-100%'], ['>100%'], ['Error %'], ['Throughput'], ['Received KB/sec'], ['Avg. Bytes']
Based on the Summary Report, the following items have been added.- Avg. seg. len.: Average length of media segments (ms).
- Resp. / Seg. len.: Response time as a percentage of media segment length.
- <50%: Percentage of requests with a response time of less than 50% of the media segment length.
- 50-90%: Percentage of requests with response times between 50% and 90% of the media segment length.
- 90-100%: Percentage of requests with response times between 90% and 100% of the media segment length.
- >100%: Percentage of requests whose response time exceeds the length of the media segment.
-
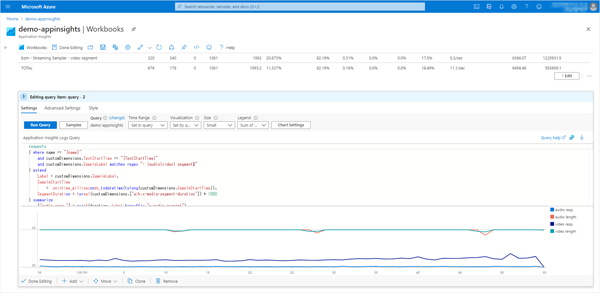
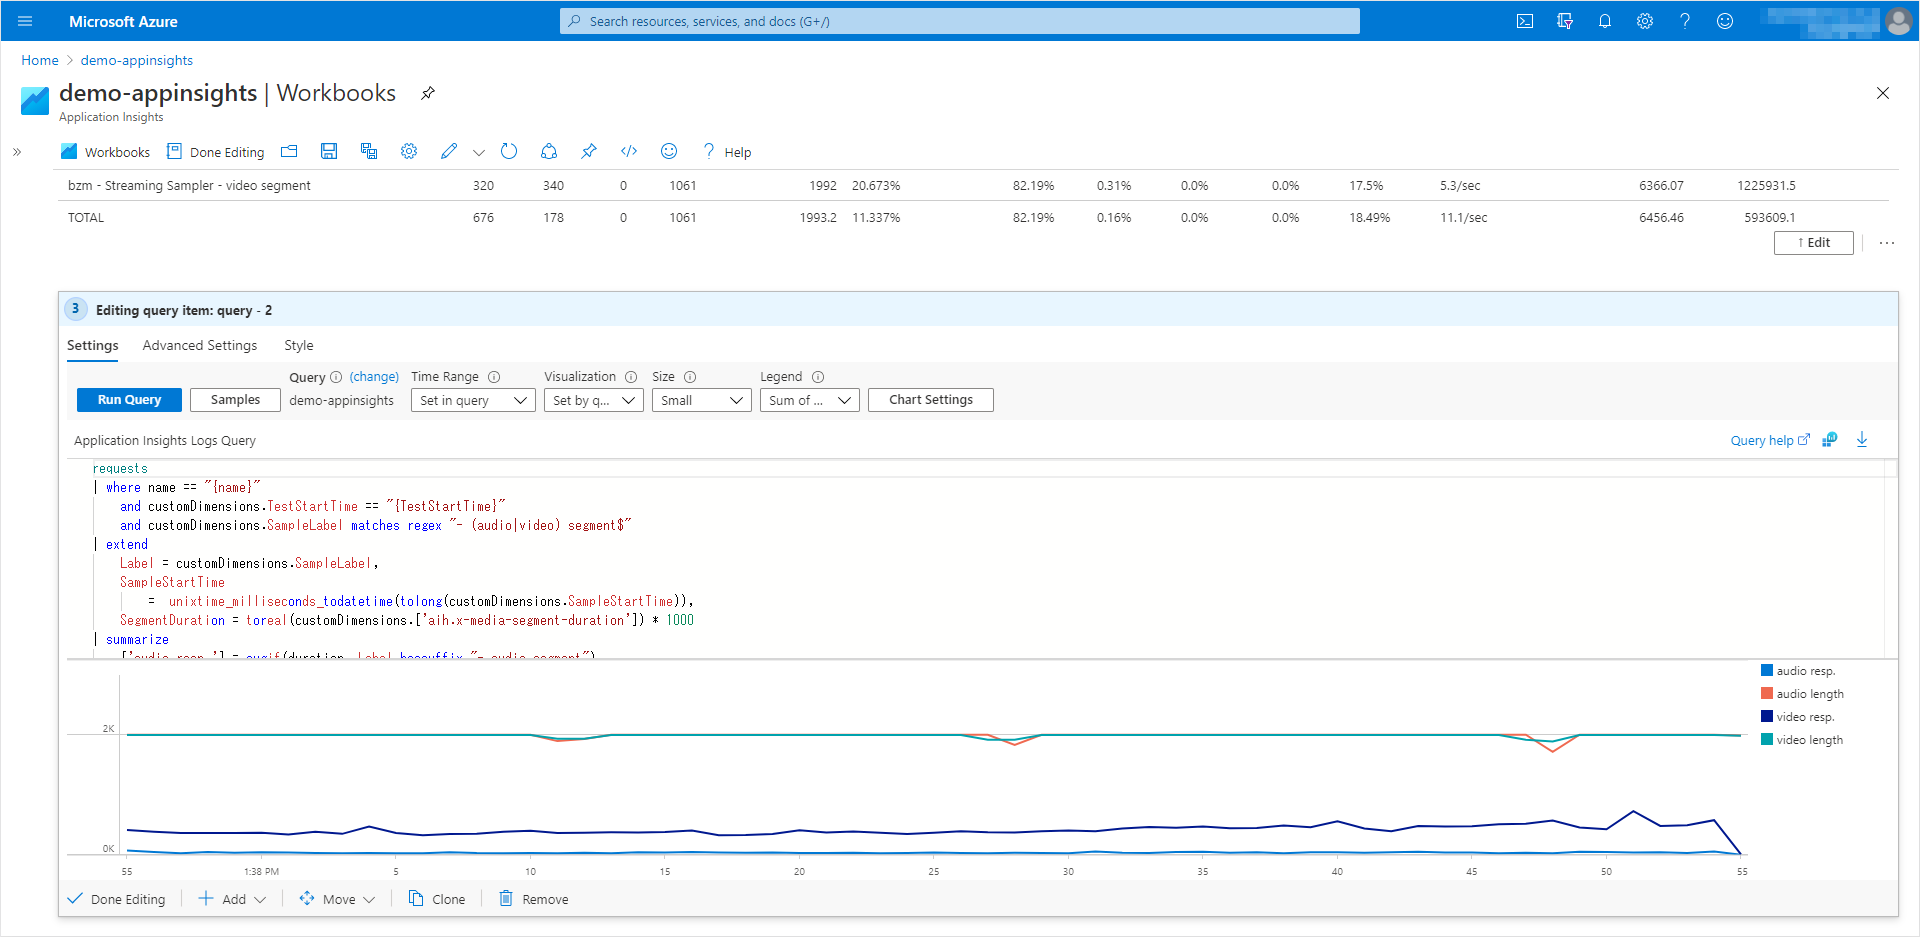
Create Graph
Click “+ Add” > “Add query” to add the Graph.
Plot the segment length in milliseconds and response time for the Video segment and Audio segment.- Application Insights Logs Query
requests | where name == "{name}" and customDimensions.TestStartTime == "{TestStartTime}" and customDimensions.SampleLabel matches regex "- (audio|video|media) segment$" | extend Label = customDimensions.SampleLabel, SampleStartTime = unixtime_milliseconds_todatetime(tolong(customDimensions.SampleStartTime)), SegmentDuration = toreal(customDimensions.['aih.x-media-segment-duration']) * 1000 | summarize ['audio resp.'] = avgif(duration, Label hassuffix "- audio segment"), ['audio length'] = avgif(SegmentDuration, Label hassuffix "- audio segment"), ['video resp.'] = avgif(duration, Label hassuffix "- video segment"), ['video length'] = avgif(SegmentDuration, Label hassuffix "- video segment"), ['media resp.'] = avgif(duration, Label hassuffix "- media segment"), ['media length'] = avgif(SegmentDuration, Label hassuffix "- media segment") by bin(SampleStartTime, totimespan("{interval}")) | project SampleStartTime, ['audio resp.'], ['audio length'], ['video resp.'], ['video length'], ['media resp.'], ['media length'] | render timechart- Time Range: Set in query
- Chart Settings
If the “Chat Settings” button does not appear, select something other than “Set by query” under “Visualization” and then select “Set by query” again.
- Legend Settings
- Show metric info: Off
- Show series legend: On
- Legend Settings
-
Save the Workbook
Click the “Save” icon to save the Workbook.

By selecting the parameters appropriately, you will see the following.

If the response time of a request for a media segment exceeds the length of that media segment, it will consume the buffer that the player client has.
It is desirable to have a low response time to media segment length ratio, as this can add up to a client running out of buffers and waiting for media to play.
This is how to run tests against Azure Media Services streaming from JMeter and refer to the results in Azure Application Insights / Log Analytics.