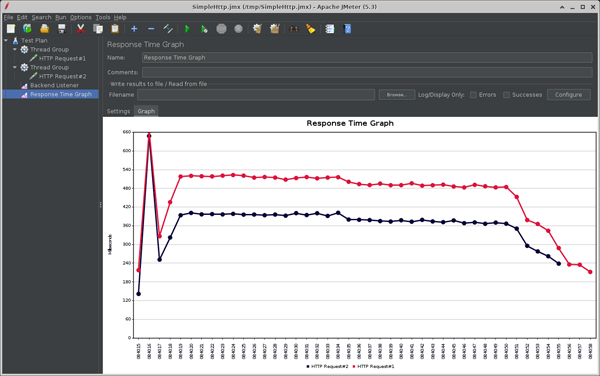
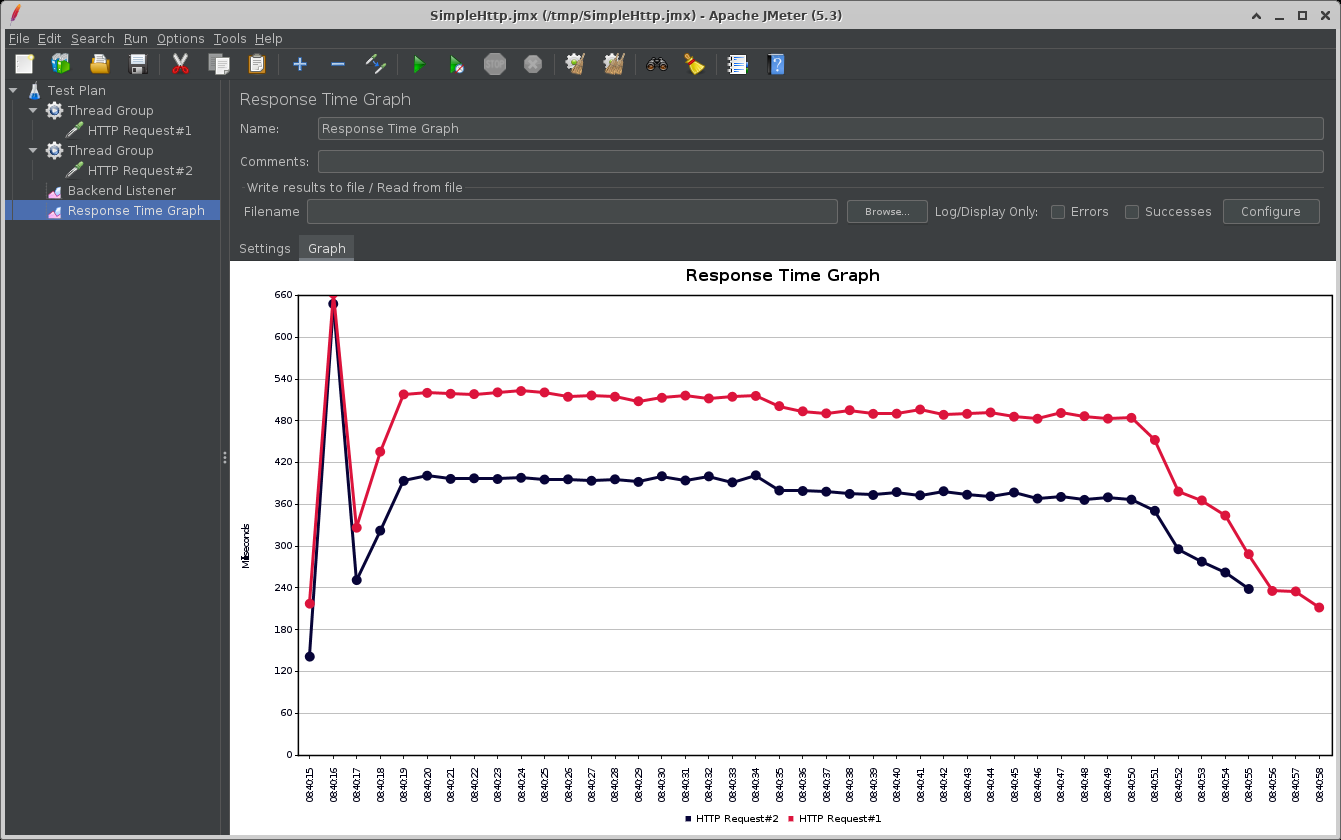
Apache JMeter™のResponse Time GraphをAzure Application Insights / Log Analyticsで表示する
Azure Application Insights / Log AnalyticsでJMeterのResponse Time Graphを見る方法を紹介します。

jmeter-backend-azureプラグインを利用してMeterでのテスト結果をAzure Application Insightsに送ることで、Application InsightsやLog AnalyticsでJMeterのテスト結果を参照することができるようになります。
今回はApplication InsightでJMeterのResponse Time Graphを表示してみましょう。
jmeter-backend-azureプラグインの導入と設定
こちらの記事を参照してください。
Application Insights / Log AnalyticsでのResponse Time Graphの表示
今回はApplication InsightsのログでResponse Time Graphを表示します。
Log Analyticsで表示する場合はテーブル名や列名が異なるので、以下の対応表に従って置き換えてください。
| - | Application Insights | Log Analytics |
|---|---|---|
| テーブル | requests | AppRequests |
| 列 | name | Name |
| duration | DurationMs | |
| customDimensions | Properties |
-
表示/分析対象の絞り込み
requests (Application Insights) / AppRequests (Log Analytics)テーブルにはApplication Insightsに送った全てのテスト結果や、JMeterではない他のログも含まれている可能性があります。
1つのテストのみを対象とした結果を表示/分析したい場合は、nameとcustomDimensions.TestStartTimeで、絞り込むことができます。(テストの度にBackend ListenerのtestNameを変更すればnameのみで絞り込むこともできます。)以下のKustoでは、nameとTestStartTimeの一覧を取得します。
requests | extend TestStartTime = tostring(customDimensions.TestStartTime) | distinct TestStartTime, name | extend formattedTestStartTime = format_datetime( unixtime_milliseconds_todatetime(tolong(TestStartTime)), 'yyyy/MM/dd HH:mm:ss' ) | sort by TestStartTime desc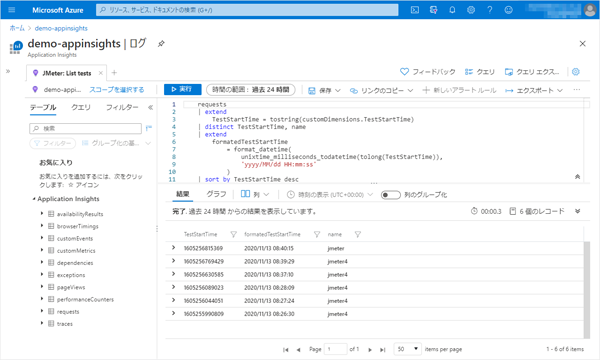
-
Response Time Graph 先ほど取得したnameとTestStartTimeを指定して、対象となるテストのResponse Time Graphを表示します。
let testName = "<先ほど取得したnameの値>"; let TestStartTime = "<先ほど取得したTestStartTimeの値>"; let interval = "<interval (100ms, 1sなど)>"; requests | where name == testName and customDimensions.TestStartTime == TestStartTime | extend Label = tostring(customDimensions.SampleLabel), SampleStartTime = unixtime_milliseconds_todatetime(tolong(customDimensions.SampleStartTime)) | summarize duration = avg(duration) by bin(SampleStartTime, totimespan(interval)), Label | render timechart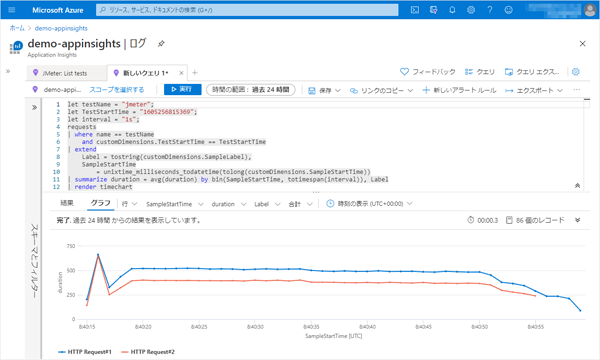


以上、JMeterのResponse Time GraphをAzure Application Insights / Log AnalyticsでKusto queryを利用して表示する方法を紹介しました。
【宣伝】
AzureにJMeterの分散テスト環境を簡単構築
『Load Tester Powered by Apache JMeter™』