Viewing JMeter Response Time Graphs in Azure Application Insights / Log Analytics
How to visualize JMeter response time graphs in Azure Application Insights / Log Analytics.

To flexibly visualize, analyze, and manage JMeter test results, you can use Azure Application Insights.
This is accomplished by using the jmeter-backend-azure plugin to send the test results to Application Insights.
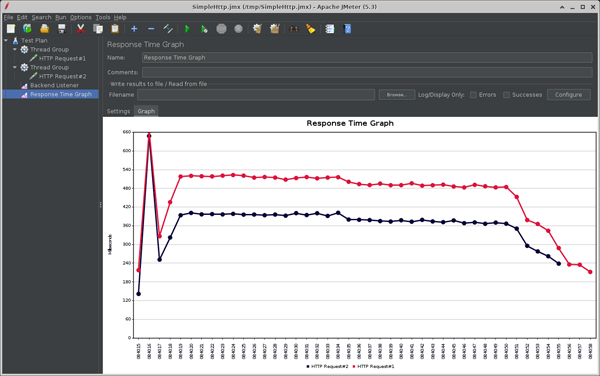
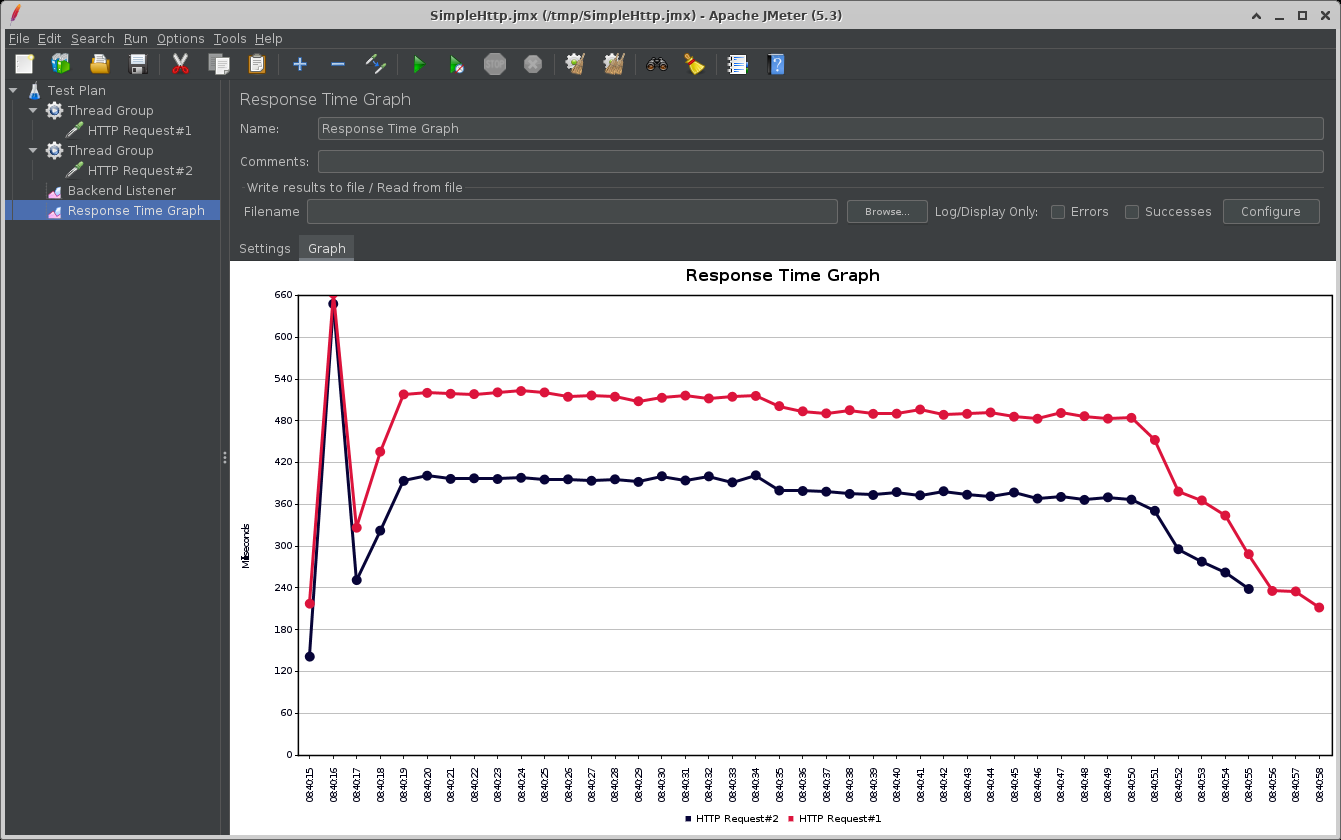
For this article, let’s take a look at JMeter’s Response Time Graph in Application Insight.
Setup the jmeter-backend-azure plugin and sending the test results to Azure Application Insights
Please refer to the jmeter-backend-azure README, which is easy to understand.
Visualizing Response Time Graph with Application Insights / Log Analytics
This section displays JMeter Response Time Graph in Application Insight.
Note that the table and column names are different between Application Insights and Log Analytics.
This is a mapping of the table and columns referenced in the samples in this article.
| - | Application Insights | Log Analytics |
|---|---|---|
| Table | requests | AppRequests |
| Columns | name | Name |
| duration | DurationMs | |
| customDimensions | Properties |
The following samples in this article are for Application Insights.
If you use Log Analytics, follow the mapping above and replace the table and column names.
-
Narrow down your view and analysis targets
“requests” (Application Insights) / “AppRequests” (Log Analytics) table may contain all the test results JMeter sent to Application Insights, as well as other logs that are not JMeter.
If you want to visualize or analyze results for a single test only, you can narrow it down with “name” and “customDimensions.TestStartTime”.You can also narrow it down by “name” only by changing the “testName” of the Backend Listener each time you test.
The following Kusto will get a list of names and TestStartTime.
requests | extend TestStartTime = tostring(customDimensions.TestStartTime) | distinct TestStartTime, name | extend formattedTestStartTime = format_datetime( unixtime_milliseconds_todatetime(tolong(TestStartTime)), 'yyyy/MM/dd HH:mm:ss' ) | sort by TestStartTime desc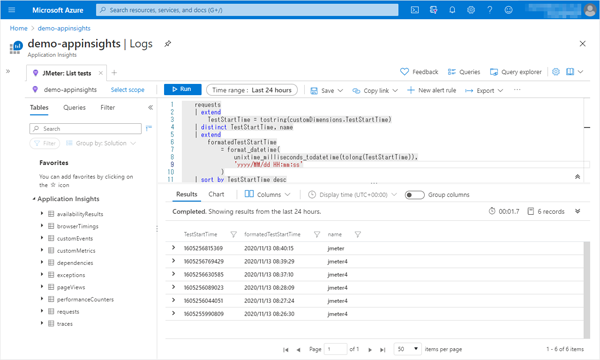
-
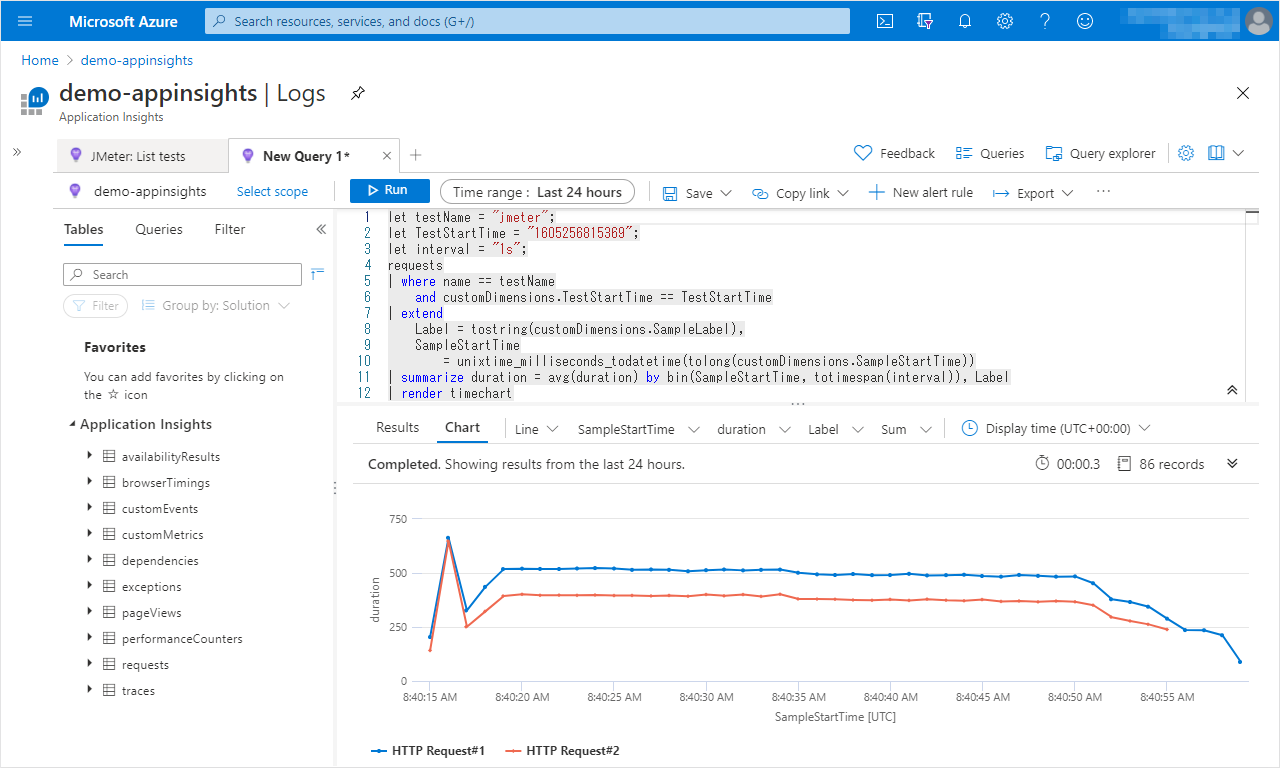
Response Time Graph It extracts the same informations as the Response Time Graph in JMeter.
let testName = "<The value of the previously obtained "name">"; let TestStartTime = "<The value of the previously obtained "TestStartTime">"; let interval = "<interval (e.g. 100ms, 1s)>"; requests | where name == testName and customDimensions.TestStartTime == TestStartTime | extend Label = tostring(customDimensions.SampleLabel), SampleStartTime = unixtime_milliseconds_todatetime(tolong(customDimensions.SampleStartTime)) | summarize duration = avg(duration) by bin(SampleStartTime, totimespan(interval)), Label | render timechart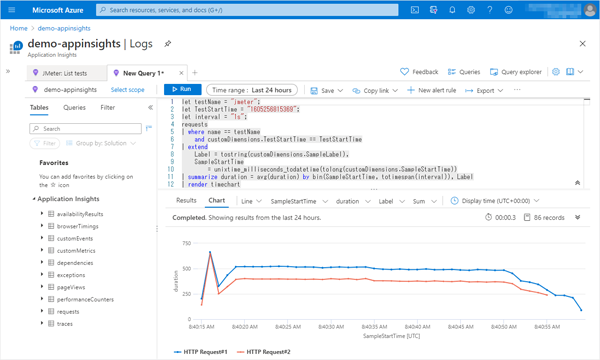

I explained how to reference JMeter Response Time Graph in Azure Application Insights using a Kusto query.