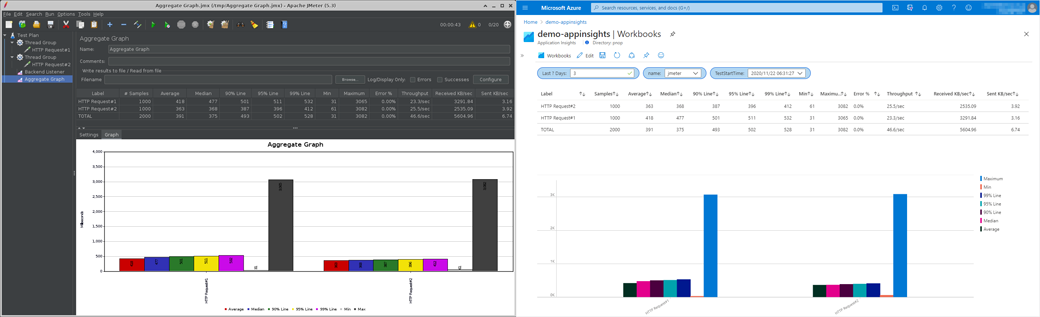
Displaying Apache JMeter™ Aggregate Graph in Application Insights / Log Analytics
How to display JMeter Aggregate Graph in Azure Application Insights / Log Analytics.

To flexibly visualize, analyze, and manage JMeter test results, you can use Azure Application Insights.
This is accomplished by using the jmeter-backend-azure plugin to send the test results to Application Insights.
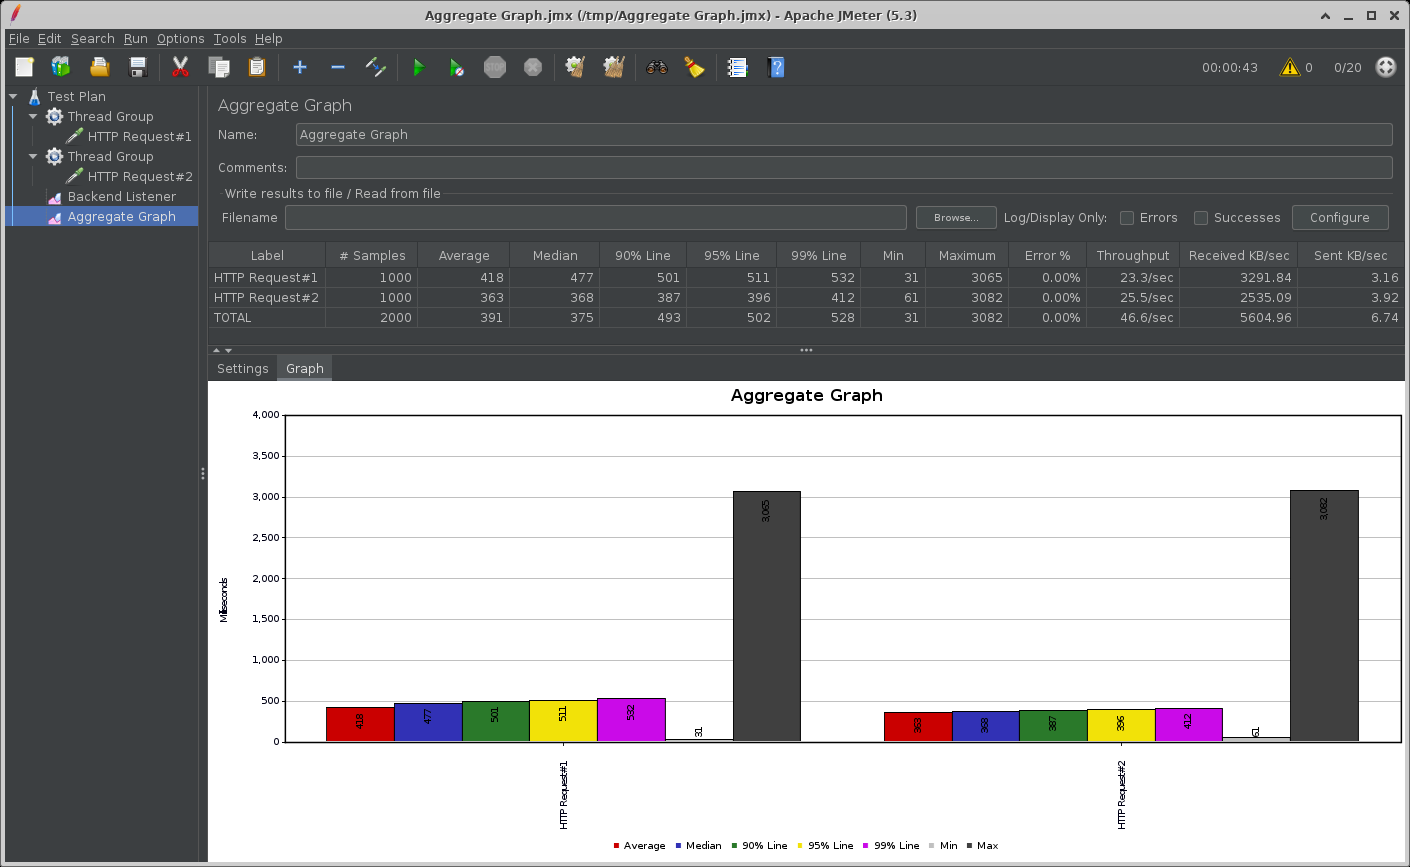
For this article, let’s take a look at JMeter Aggregate Graph in Application Insight.
Setup the jmeter-backend-azure plugin and sending the test results to Azure Application Insights
Please refer to the jmeter-backend-azure README, which is easy to understand.
Displaying Aggregate Graph with Application Insights / Log Analytics
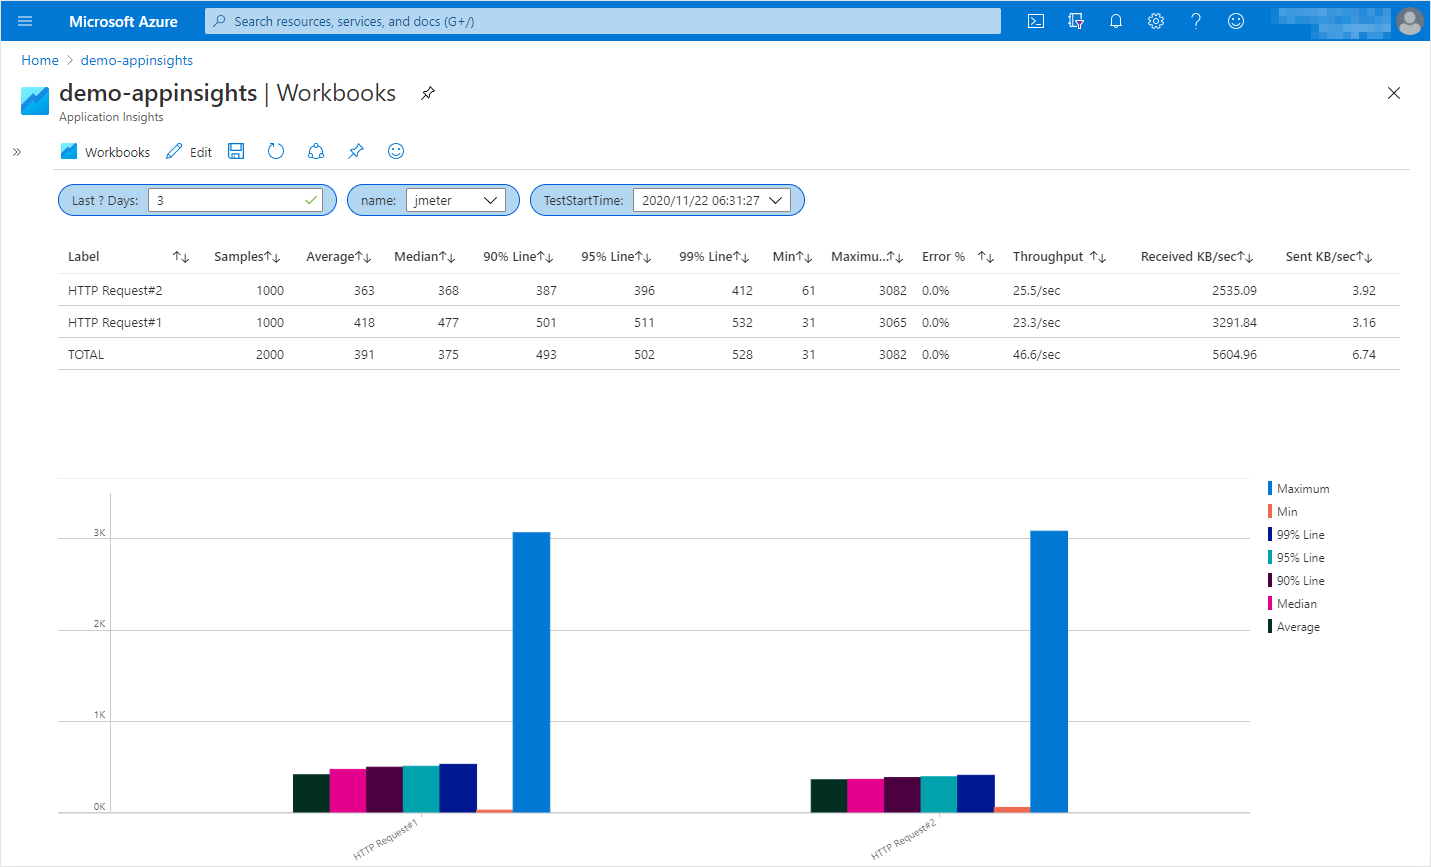
This section displays JMeter Aggregate Graph in Workbooks of Application Insight.
Note that the table and column names are different between Application Insights and Log Analytics.
This is a mapping of the table and columns referenced in the samples in this article.
| - | Application Insights | Log Analytics |
|---|---|---|
| Table | requests | AppRequests |
| Columns | timestamp | TimeGenerated |
| name | Name | |
| success | Success | |
| duration | DurationMs | |
| customDimensions | Properties |
-
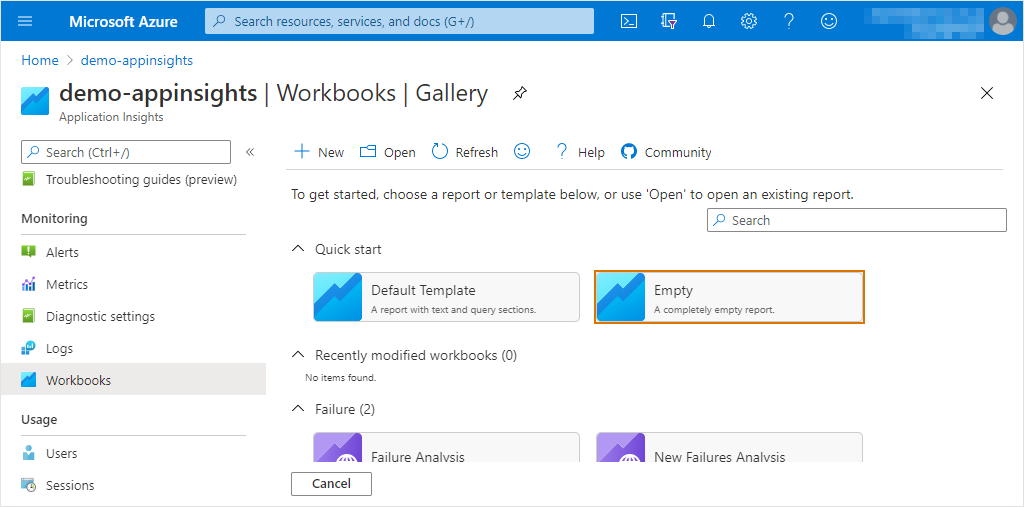
Create Workbook of Application Insights
Open the Application Insights Workbooks to which JMeter is sending the results and click “Empty” in the Quick start.

-
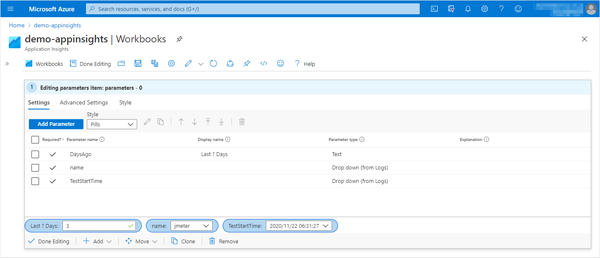
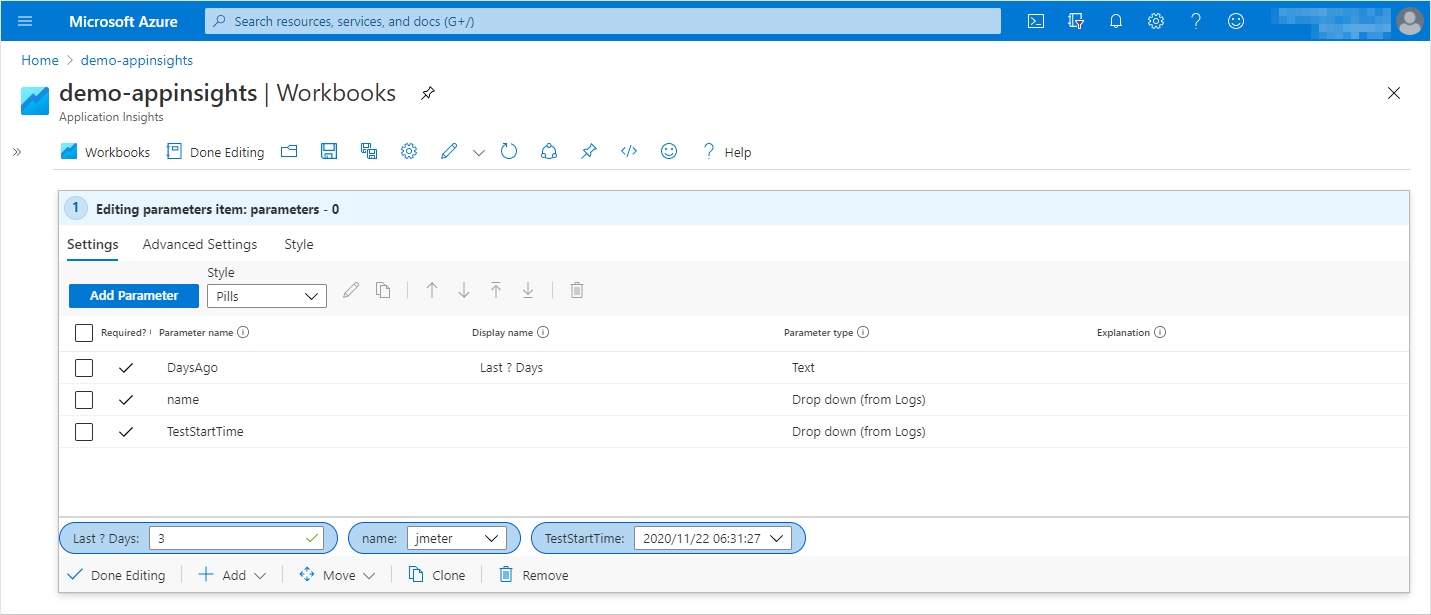
Add parameters
To create a selection of test results to be displayed, “+ Add” > “Add parameter” and add the following parameters.-
Parameter 1
- Parameter name: DaysAgo
- Display name: Last ? Days
- Parameter type: Text
- Required?: On
- Add Validations
- Regular Expression: ^[0-9]+$
- Match: On
- Message: Enter a number greater than 1.
-
Parameter 2
- Parameter name: name
- Parameter type: Drop down
- Required?: On
- Get data from: Query
- Application Insights Logs Query
-
Time Range: Set in query
-
Kusto
requests | where timestamp >= ago({DaysAgo}d) | summarize TestStartTime = max(tolong(customDimensions.TestStartTime)) by name = tostring(name) | sort by TestStartTime desc | project name
-
-
Parameter 3
- Parameter name: TestStartTime
- Parameter type: Drop down
- Required?: On
- Get data from: Query
- Application Insights Logs Query
-
Time Range: Set in query
-
Kusto
requests | where name == "{name}" and timestamp >= ago({DaysAgo}d) | extend TestStartTime = tostring(customDimensions.TestStartTime) | distinct TestStartTime | project TestStartTime, formattedTestStartTime = format_datetime( unixtime_milliseconds_todatetime(tolong(TestStartTime)), 'yyyy/MM/dd HH:mm:ss' ) | sort by TestStartTime desc
-
Once you are done with the settings, choose the appropriate value.
-
-
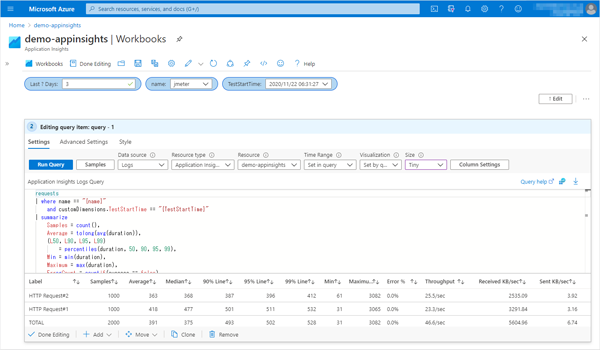
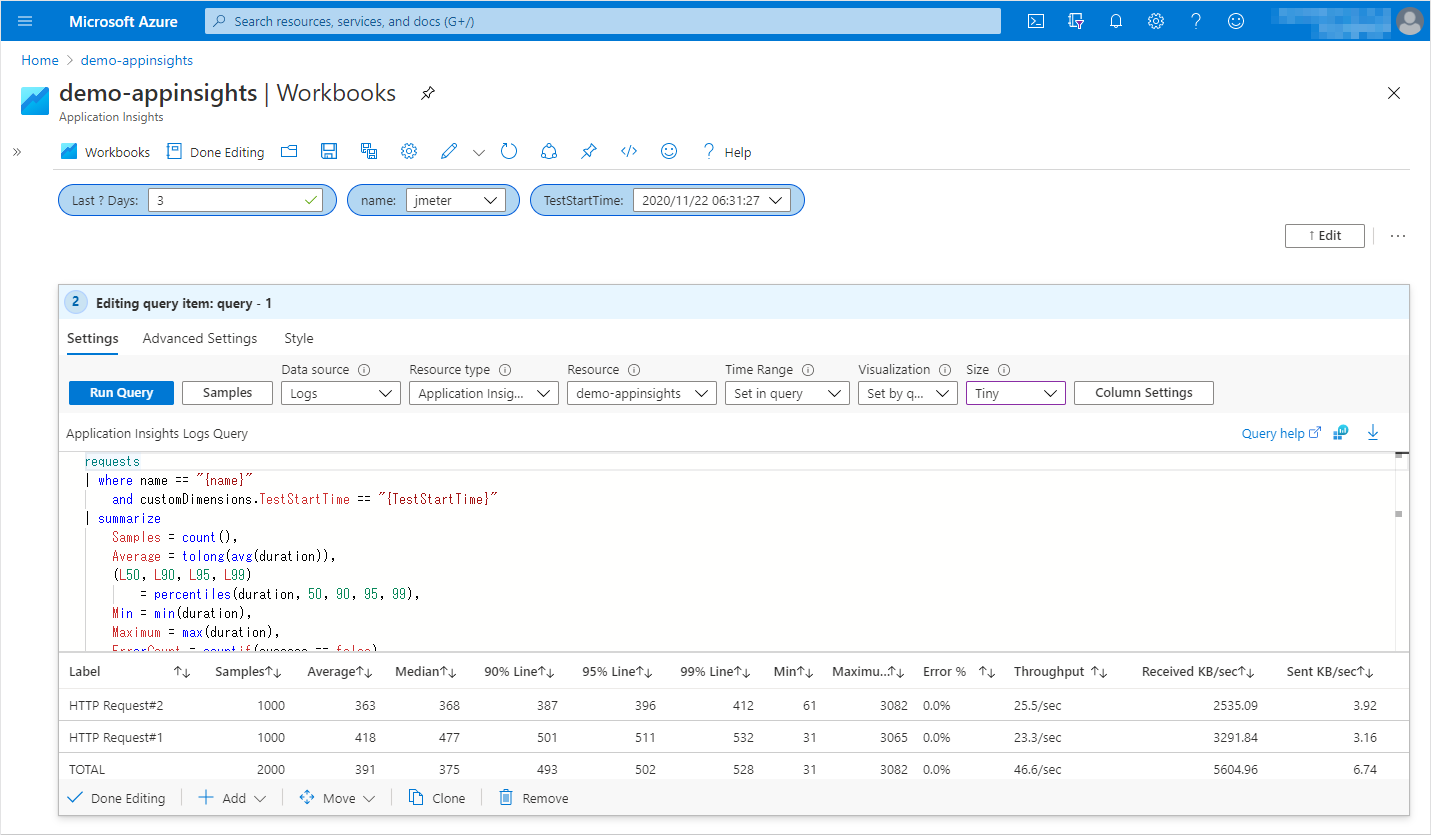
Create Aggregate Report
Click “+ Add” > “Add query” to add the Aggregate Report.-
Time Range: Set in query
-
Application Insights Logs Query
requests | where name == "{name}" and customDimensions.TestStartTime == "{TestStartTime}" | summarize Samples = count(), Average = tolong(avg(duration)), (L50, L90, L95, L99) = percentiles(duration, 50, 90, 95, 99), Min = min(duration), Maximum = max(duration), ErrorCount = countif(success == false), ReceivedKB = sum(tolong(customDimensions.Bytes)), SentKB = sum(tolong(customDimensions.SentBytes)), StartTime = min(tolong(customDimensions.SampleStartTime)), EndTime = max(tolong(customDimensions.SampleEndTime)) by Label = tostring(customDimensions.SampleLabel) | extend s = 0 | union ( requests | where name == "{name}" and customDimensions.TestStartTime == "{TestStartTime}" | summarize Samples = count(), Average = tolong(avg(duration)), (L50, L90, L95, L99) = percentiles(duration, 50, 90, 95, 99), Min = min(duration), Maximum = max(duration), ErrorCount = countif(success == false), ReceivedKB = sum(tolong(customDimensions.Bytes)), SentKB = sum(tolong(customDimensions.SentBytes)), StartTime = min(tolong(customDimensions.SampleStartTime)), EndTime = max(tolong(customDimensions.SampleEndTime)) | extend Label = 'TOTAL', s = 9 ) | extend tp = Samples / ((EndTime - StartTime) / 1000.0), KBPeriod = (EndTime - StartTime) * 1024 / 1000.0 | sort by s asc | project Label, Samples, Average, Median = round(L50), ['90% Line'] = round(L90), ['95% Line'] = round(L95), ['99% Line'] = round(L99), Min, Maximum, ['Error %'] = strcat(round(ErrorCount * 100.0 / Samples, 2), '%'), ['Throughput'] = iif(tp < 1.0, strcat(round(tp * 60, 1), '/min'), strcat(round(tp, 1), '/sec') ), ['Received KB/sec'] = round(ReceivedKB / KBPeriod, 2), ['Sent KB/sec'] = round(SentKB / KBPeriod, 2) | project-reorder Label, Samples, Average, ['Median'], ['90% Line'], ['95% Line'], ['99% Line'], Min, Maximum, ['Error %'], ['Throughput'], ['Received KB/sec'], ['Sent KB/sec']
-
-
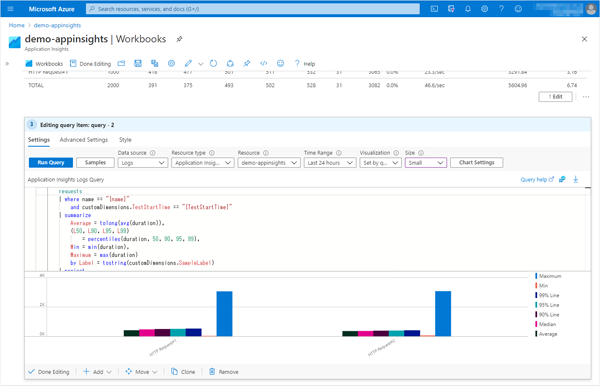
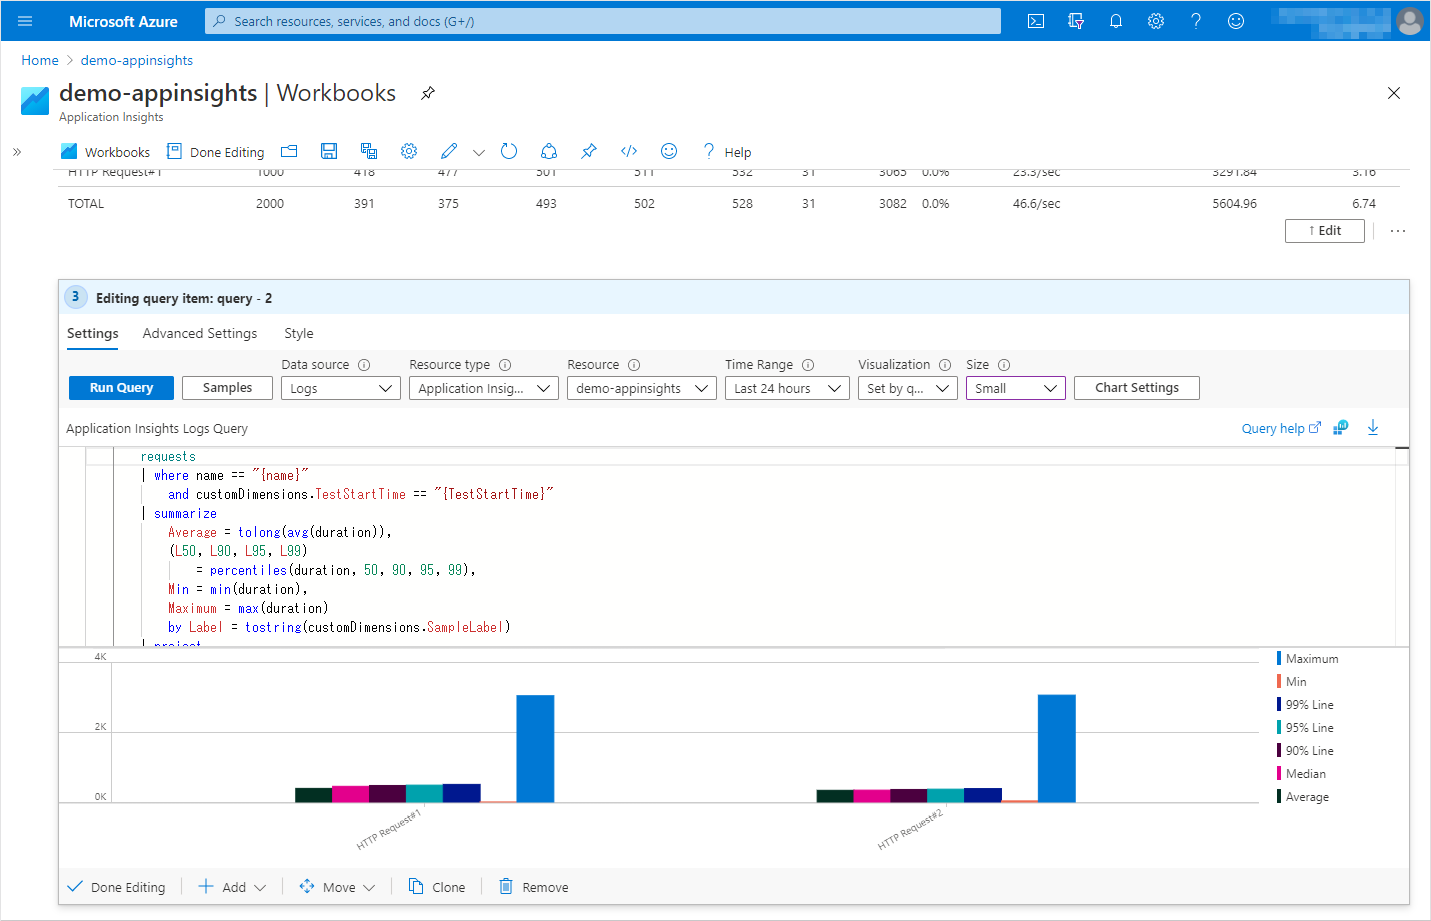
Create Aggregate Graph
Click “+ Add” > “Add query” to add the Aggregate Graph. In this tutorial, display the bar charts of Average, Median, 90% Line, 95% Line, 99% Line, Min, and Max.-
Time Range: Set in query
-
Application Insights Logs Query
requests | where name == "{name}" and customDimensions.TestStartTime == "{TestStartTime}" | summarize Average = tolong(avg(duration)), (L50, L90, L95, L99) = percentiles(duration, 50, 90, 95, 99), Min = min(duration), Maximum = max(duration) by Label = tostring(customDimensions.SampleLabel) | project Label, Average, ['Median'] = round(L50), ['90% Line'] = round(L90), ['95% Line'] = round(L95), ['99% Line'] = round(L99), Min, Maximum | project-reorder Label, Maximum, Min, ['99% Line'], ['95% Line'], ['90% Line'], Median, Average | render barchart with (kind = unstacked) -
Visualization: Set by query
After entering Kusto Query in “Application Insights Logs Query”, set this value to something other than “Set by query” and then set it back to “Set by query”. -
Chart Settings
As I wrote before, select “Set by query” in Visualization and “Chart settings” button will appear.
- X axis Settings
- Column: Label
- Legend Settings
- Show metric info: Off
- Show series legend: On
- X axis Settings
-
-
Save the Workbook
Click the “Save” icon to save the Workbook.
By selecting the parameters appropriately, you will see the following.
I explained how to display JMeter Aggregate Graph in Azure Application Insights.